Telling Drones from Birds with Micro-Doppler Radar
Micro-Doppler is the modulation of a radar return caused by motion within an object, including rotating propeller blades and flapping wings. This study uses simulated returns to examine those contributions.
The study compares a rotating-blade simulation with analytic expressions, evaluates classification on synthetic signals, and reports historical analyses of cached features from a published dataset.
The calculations have not been validated against physical rotor measurements. The public-data analysis has an unresolved array-axis interpretation. The reported classification scores do not establish field performance.
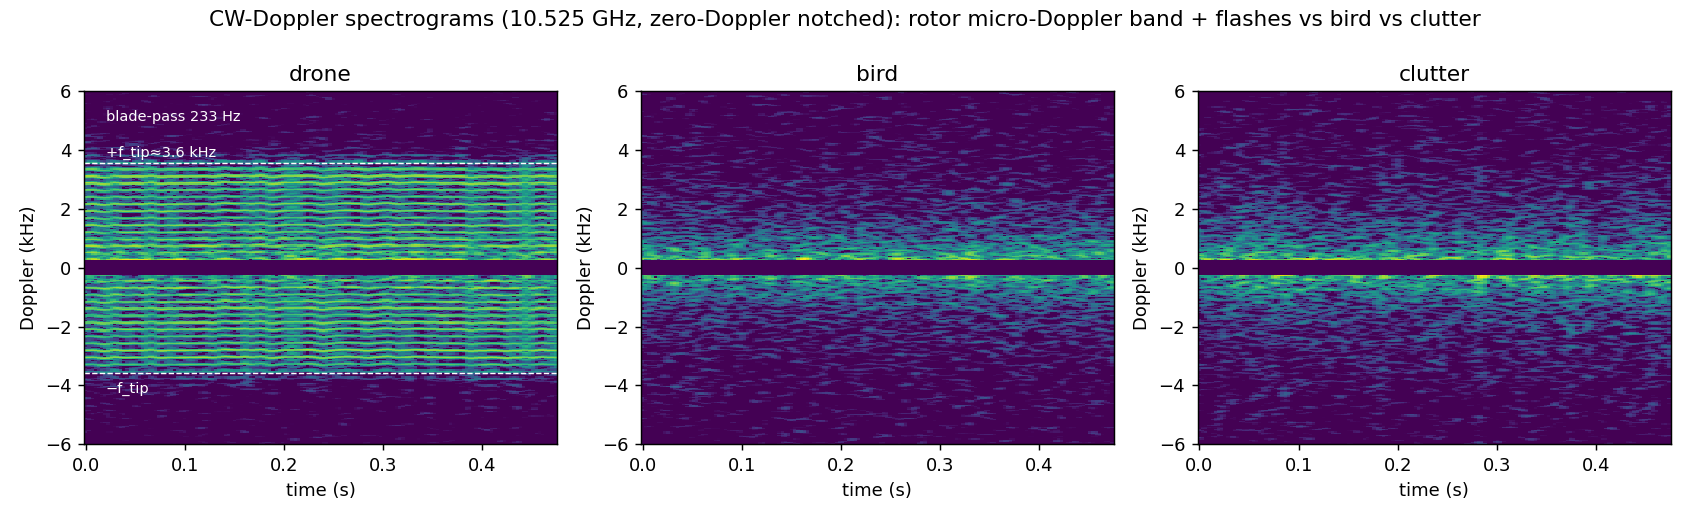
detection_study.py, figure D4. Click the figure to view it at full size.Doppler shift
For a radar whose transmitter and receiver are at the same location, radial motion produces a Doppler shift:
fD = 2vr / λ
Here vr is radial velocity and λ is wavelength. The body return depends on the object’s translational motion. Rotation changes each blade element’s radial velocity and phase contribution. In the simulated examples above, the drone return occupies a wider frequency band than the modeled bird return.
Rotating-blade model
The model treats each blade as a line of scatterers from hub to tip, following the rotating-blade treatment of Martin and Mulgrew and of Chen and colleagues.1 The returns add coherently, so the signal depends on phase as well as amplitude. The largest Doppler excursion depends on blade-tip speed and viewing angle:
ftip = 2ΩL cos β / λ
Ω is angular speed, L is blade radius, and β is the angle between the line of sight and the rotor plane. The expression increases with blade-tip speed and approaches zero when the line of sight is along the rotor axis. The nominal blade-pass frequency is:
fblade = N · rpm / 60
where N is the number of blades.
The comparison covers 40 two-blade configurations: 36 at 10.525 GHz and four at 24.125 GHz. The estimated band edge differs from the analytic tip-Doppler value by a mean absolute percentage error of 6.7% and a maximum of 10.5%.
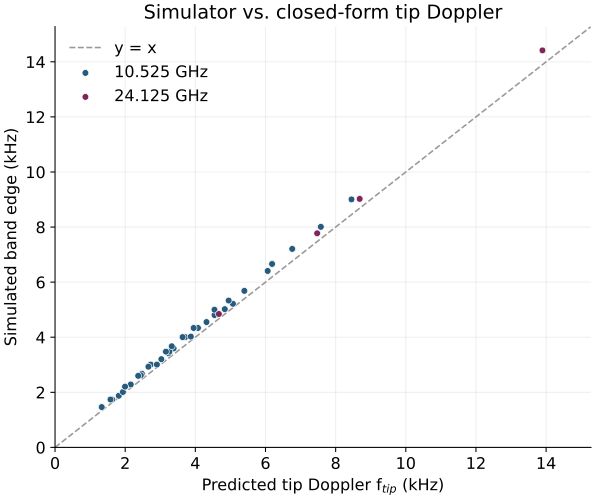
This comparison tests the implementation against an expression from the same model. It does not test the scattering assumptions against a physical rotor. All 40 configurations use two blades. Separate clean one- and three-blade examples returned cadence estimates twice the nominal blade-pass frequency. That harmonic ambiguity remains unresolved.
Synthetic classification results
The synthetic experiment extracts features from the return (Doppler bandwidth, spectral entropy, cadence, and related quantities) and trains a random-forest classifier to separate drones from bird and clutter examples. Five-fold cross-validation tests on held-out synthetic samples.
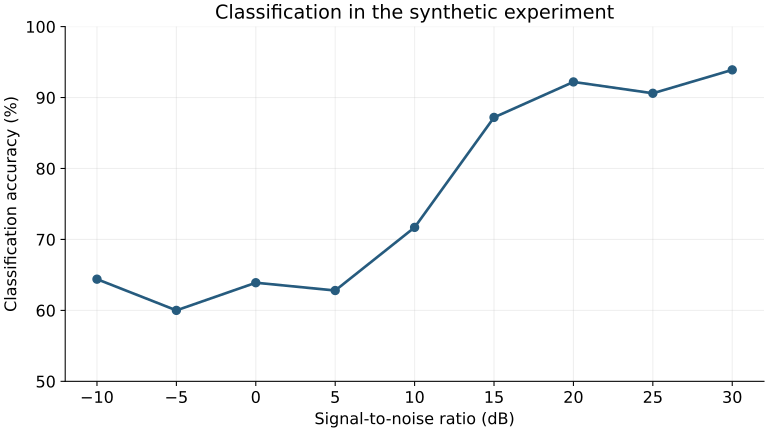
Accuracy in the synthetic experiment is 71.7% at 10 dB, 87.2% at 15 dB, 92.2% at 20 dB, and 93.9% at 30 dB. The saved value at 25 dB is 90.6%, so accuracy is not monotonic across the tested levels. The class distribution gives a majority-class baseline of approximately two-thirds. These results do not establish a general 15 dB classification requirement.
The simulator defines SNR using total synthesized power after adding clutter. The separate link-budget calculation uses a coherently integrated blade return. These definitions have not been reconciled. The classification curve therefore does not establish a physical operating range.
Stored band comparison
For the same rotor geometry and speed, the tip-Doppler expression scales inversely with wavelength. The stored band comparison holds antenna aperture fixed and includes an atmospheric-absorption term. Its range estimates depend on the assumed radar cross section and other model inputs.
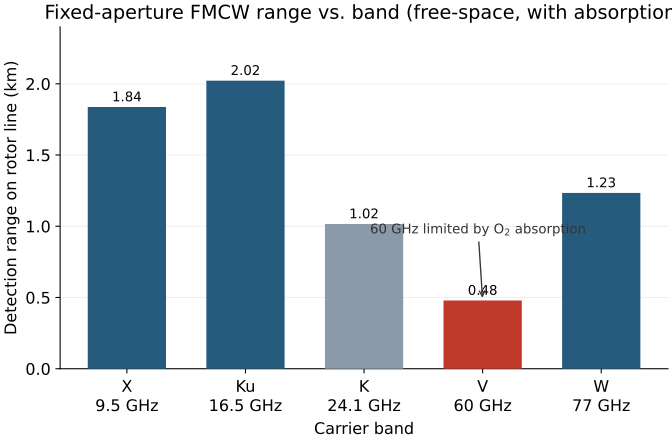
The stored calculation gives approximately 0.48 km at 60 GHz, 1.23 km at 77 GHz, and 2.02 km at Ku band. These are outputs of the stated model. No range measurements are provided, and these calculations alone do not establish a preferred radar band.
The separate continuous-wave link-budget calculations use a blade radar cross section of approximately 10−3 m². That value is an assumption requiring measurement. The reported ranges also depend on the signal-power and integration conventions identified in the review.
Cached public-data analysis
The published dataset contains 60 GHz chamber measurements of small drones and a bionic bird by Kang and colleagues.2 The local cache contains 614 windows from 101 capture files. Cross-validation keeps windows from each capture together. The table compares saved scores with the earlier audit rerun. The audit used scikit-learn 1.9.1; the cause of the score differences has not been isolated.
| Experiment | Saved | Earlier audit rerun |
|---|---|---|
| All drone / bionic bird | 84.0% / 0.924 | 82.4% / 0.913 |
| Rotor-active subset | 90.5% / 0.971 | 89.5% / 0.969 |
| Still subset | 77.1% / 0.895 | 80.8% / 0.894 |
| Phantom 3 / Mavic | 70.7% / 0.686 | 69.9% / 0.670 |
| Three classes | 73.8% / not reported | 72.5% / not reported |
The cached features have an unresolved physical interpretation. The local code assumes sample and chirp axes; the authors’ processing crops spatial images and extracts phase histories at fixed pixels.4 The raw Data.zip archive is absent, preventing a direct schema check. The cached extent feature is constant across all 614 windows. The population consists of drones and a bionic bird in a chamber, so these evaluations do not measure discrimination of natural birds in the field. The stacked-fusion score is omitted because its evaluation leaks information between stages.
Unresolved work
The rotor implementation reproduces the analytic band-edge relation within the errors reported above for the tested two-blade configurations. The synthetic classification scores apply to the generated examples and the simulator’s SNR definition. The cached-data scores remain historical results pending verification of the preprocessing.
Unresolved work includes cadence harmonic ambiguity, inconsistent FMCW sampling parameters, signal-power definitions, and measured-data preprocessing. Physical rotor measurements and independent natural-bird data are also absent. The model and sensor have not been physically validated.
Sources and project notes
- V. C. Chen et al., Micro-Doppler effect in radar: phenomenon, model, and simulation study, IEEE Transactions on Aerospace and Electronic Systems, 42(1), 2006. See also J. Martin and B. Mulgrew, Analysis of the theoretical radar return signal from aircraft propeller blades, 1990.
- Kang, Forsten, Semkin, and Rangan, Millimeter-wave (60 GHz) radar measurements of UAS and birds, IEEE DataPort, 2024. See the authors' measurement paper. The scores above are local cached-feature analyses, not the authors' reported model performance.
- S. Rahman and D. A. Robertson, Radar micro-Doppler signatures of drones and birds at K-band and W-band, Scientific Reports, 2018.
- Kang and colleagues, upstream processing: image cropping and pixel phase histories. These establish a provenance conflict; the missing local archive prevents a definitive schema check.